
Search Our Database
How to Enable Failed Request Tracing (FREB) in IIS for Common Errors
Introduction
Failed Request Tracing (FREB) in Microsoft Internet Information Services (IIS) is a powerful diagnostic tool that captures detailed execution logs for problematic web requests. System administrators and web developers can use FREB to troubleshoot common HTTP issues, such as 500 Internal Server Errors, 403 Forbidden access, or slow-loading pages, without impacting overall server performance. This basic guide explains how to quickly enable the FREB feature and configure rules to capture logs for the most frequent website errors on your Windows Server.
Prerequisite
- Access to a Windows Server with Administrator privileges.
- IIS Manager installed and accessible.
- The Tracing role service must be installed (via Server Manager > Manage > Add Roles and Features > Server Roles > Web Server (IIS) > Web Server > Health and Diagnostics > Tracing).
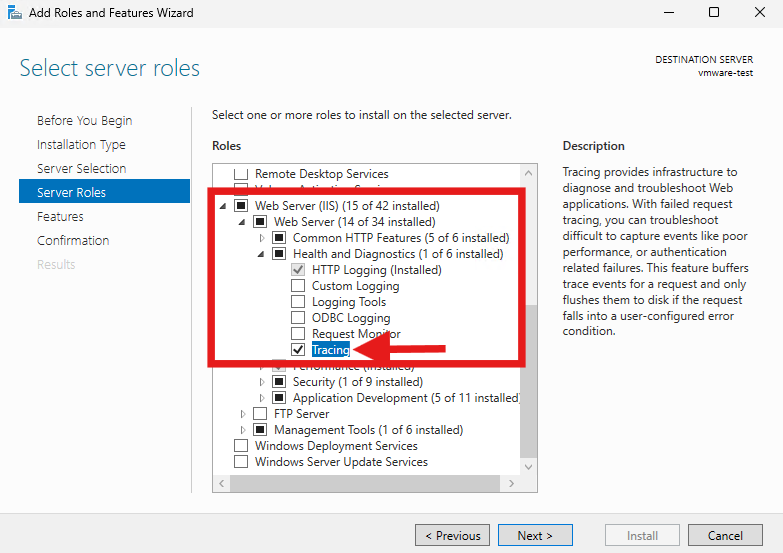
Step-by-step Guide
Step 1: Enable FREB at the site level
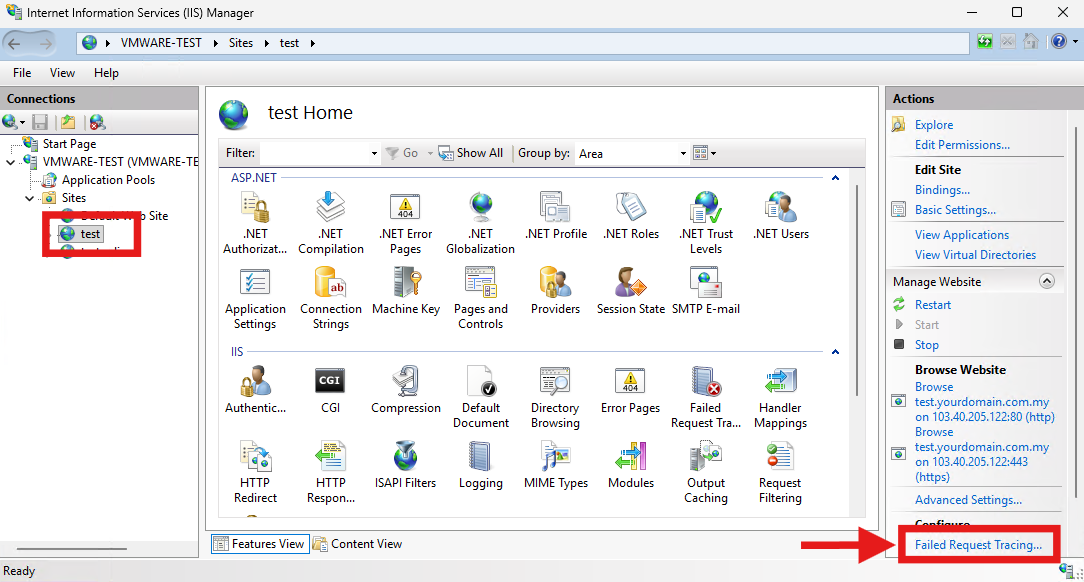
- Open IIS Manager and select your specific website from the left-hand Connections panel. In the right-hand Actions pane, click on Failed Request Tracing… under the Configure heading.
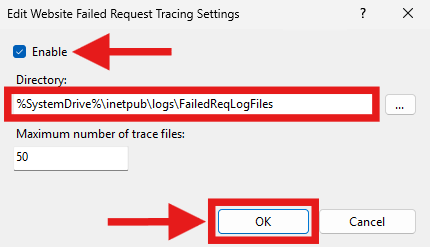
- Check the Enable box, note the default directory (%SystemDrive%\inetpub\logs\FailedReqLogFiles), and click OK.
Step 2: Add a tracing rule
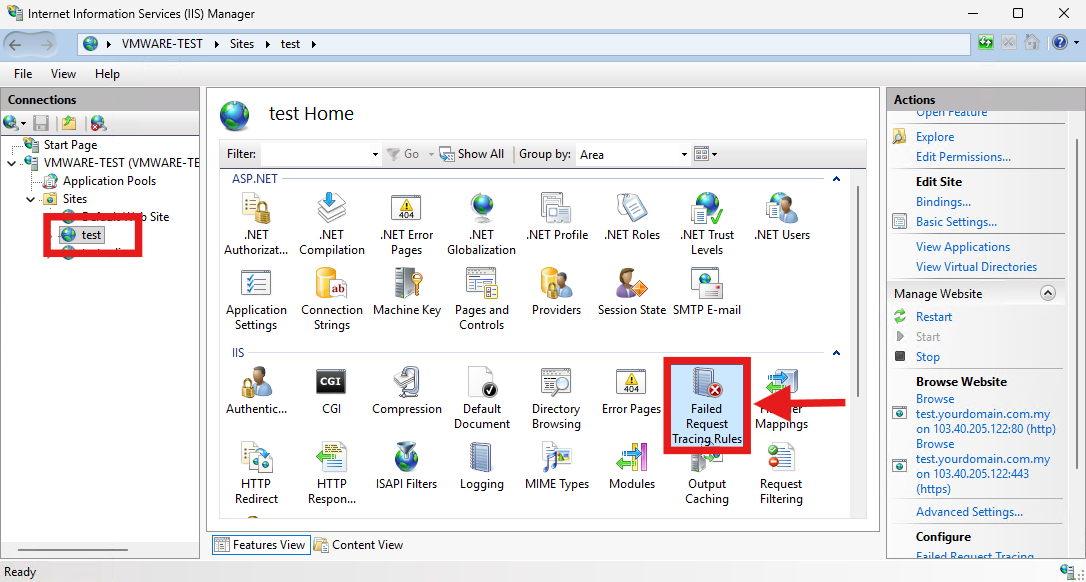
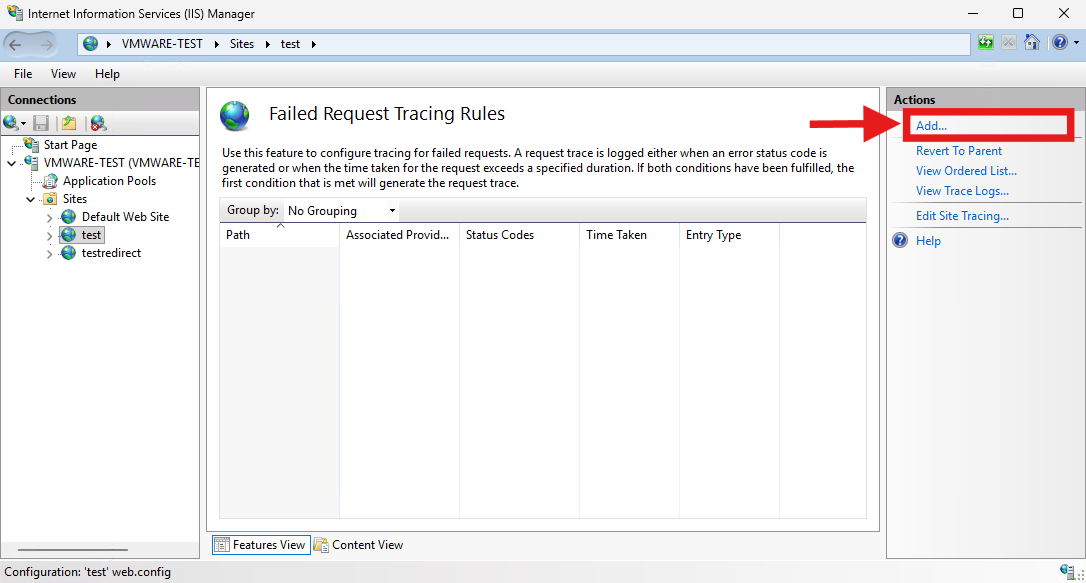
- In the main IIS Manager view for your website, double-click the Failed Request Tracing Rules icon.
- Click Add… in the right-hand Actions pane to open the wizard.
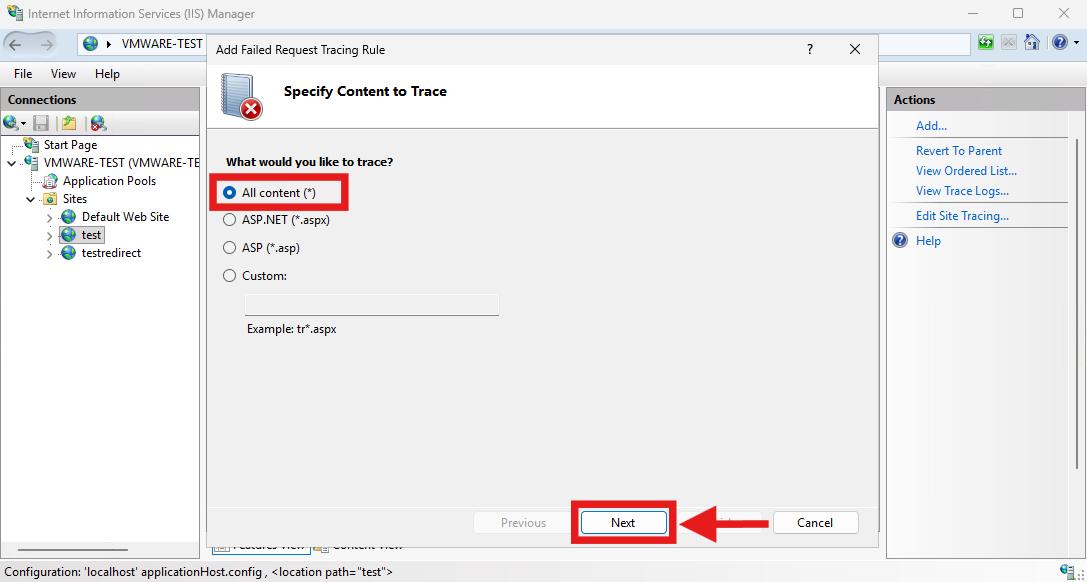
- On the Specify Content to Trace page, select All content (*) and click Next.
Step 3: Define common error conditions
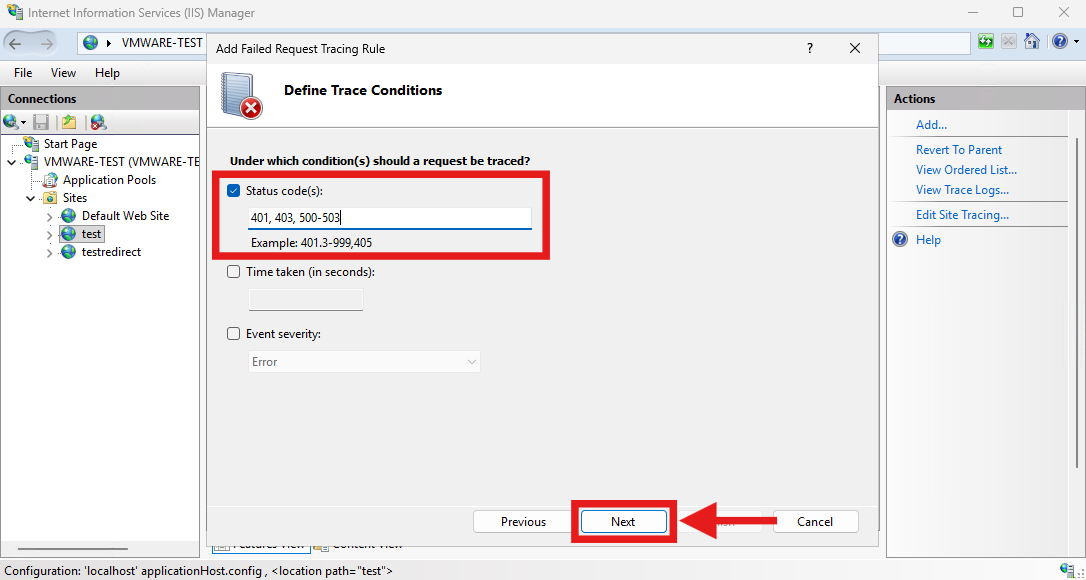
- On the Define Trace Conditions page, select the Status code(s) checkbox. To capture the most common server errors, enter 401, 403, 500-503 in the text field.
- Here is what these common error codes represent:
- 401: Unauthorized (Authentication failure)
- 403: Forbidden (Permission or IP restriction issues)
- 500: Internal Server Error (Application crashes or bad configurations)
- 502: Bad Gateway (FastCGI or reverse proxy timeouts)
- 503: Service Unavailable (Application pool stopped or overloaded)
- Click Next to proceed.
Step 4: Select trace providers
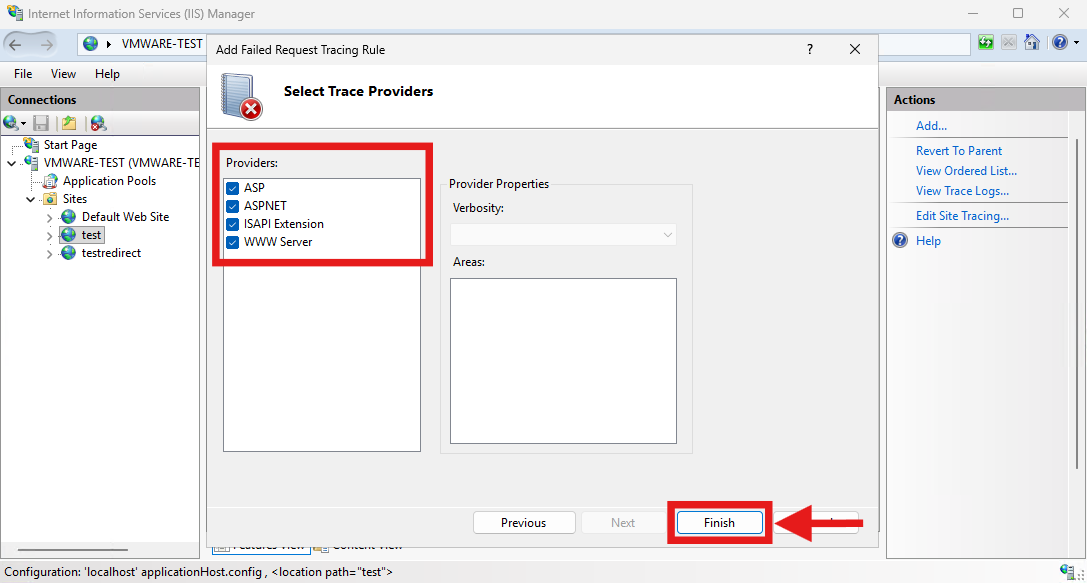
On the Select Trace Providers page, leave all default providers checked (such as ASP, ASP.NET, ISAPI Extension, and WWW Server) to ensure comprehensive logging. Click Finish to save the rule.
Step 5: Access and review the logs
Once a configured error occurs on your website, IIS will automatically generate an XML log file. Navigate to C:\inetpub\logs\FailedReqLogFiles (or your custom path) and open the generated .xml file in Internet Explorer or Edge to view the detailed diagnostic breakdown.
Conclusion
By following this guidance, you can successfully enable Failed Request Tracing in IIS and configure it to capture diagnostic logs for the most common website errors.
If you require any assistance, please contact us at support@ipserverone.com.