
Search Our Database
How to Monitor Advanced System Performance Using Atop on Linux
Introduction
Atop is an advanced Linux system and process monitoring utility that provides detailed information on CPU utilization, memory consumption, disk activity, network usage, and running processes. It supports real-time performance monitoring and historical analysis through recorded system activity logs, allowing administrators to identify resource-intensive processes and troubleshoot performance issues. This guide demonstrates how to install and use Atop to monitor system performance on a Linux server.
Prerequisite
- SSH access with root or sudo privileges.
- Basic familiarity with Linux command-line operations.
-
Basic understanding of system resource monitoring (CPU, memory, disk, and network).
Step-by-Step Guide
Step 1: Install Atop on Linux
The installation procedure varies depending on the Linux distribution. Select the appropriate method below.
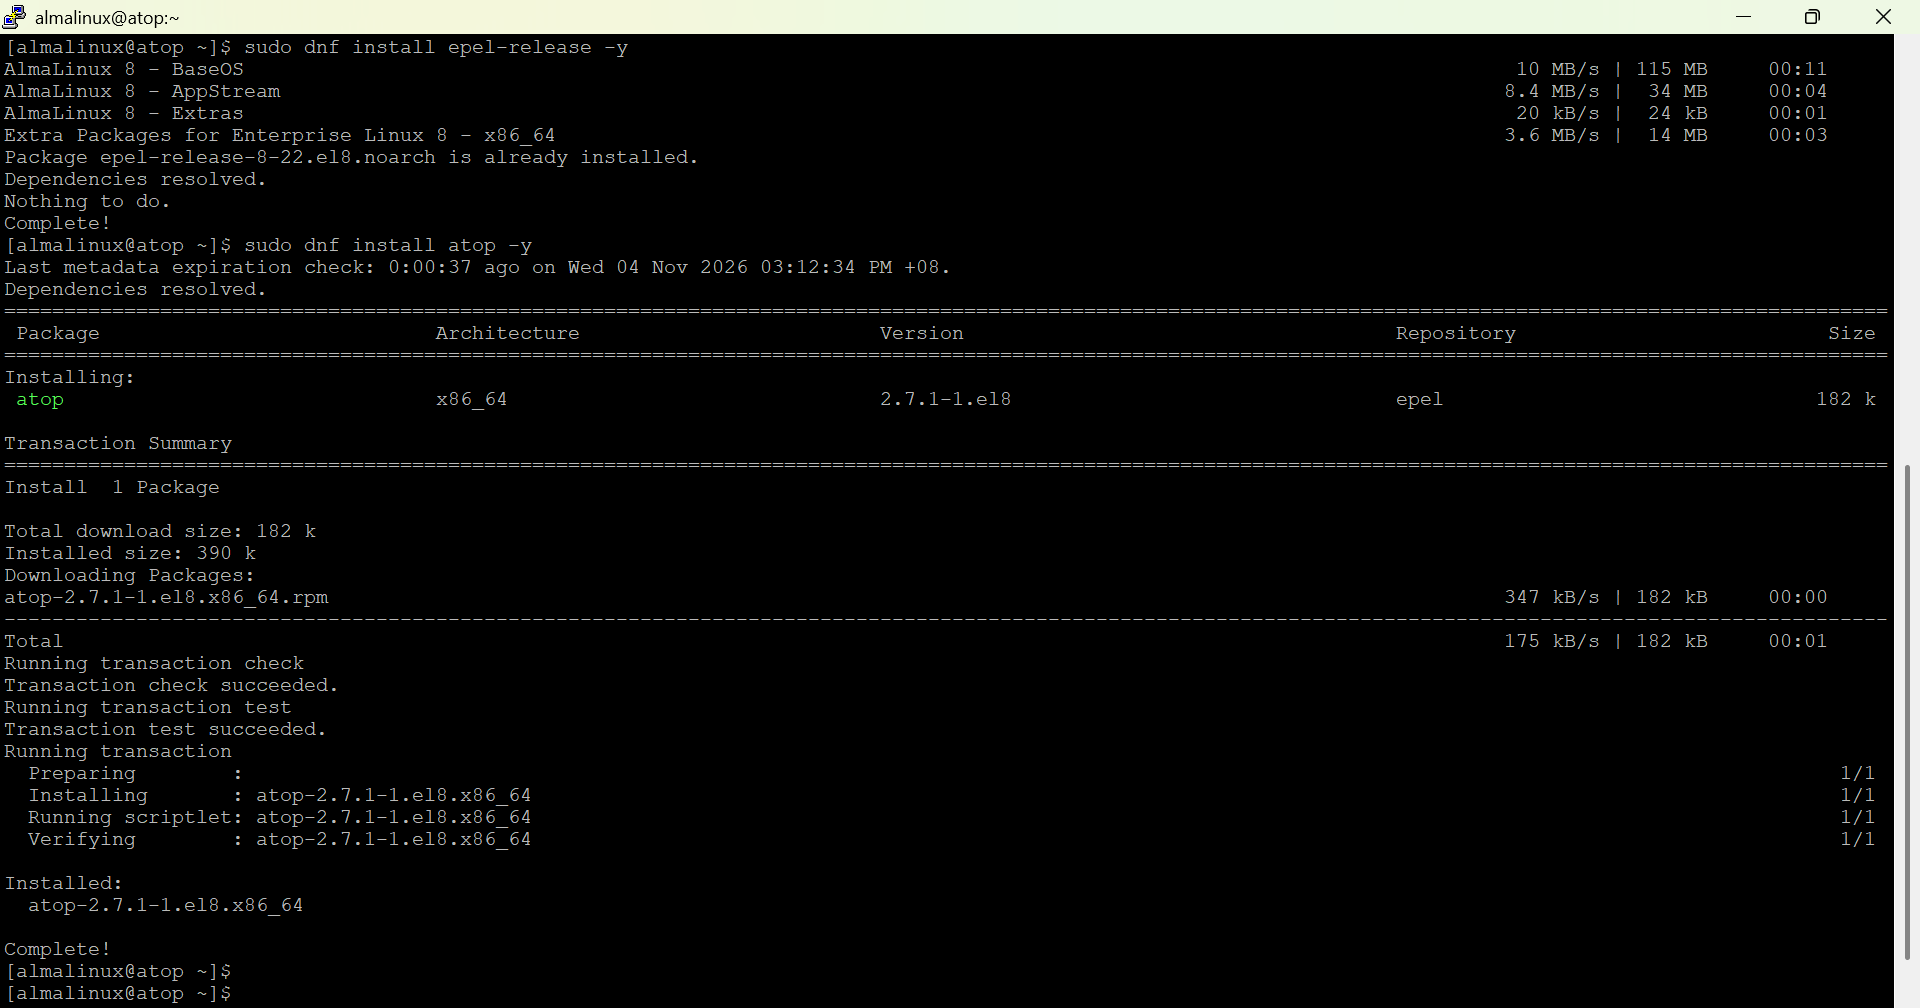
- Install the Extra Packages for Enterprise Linux (EPEL) repository using the following command:
sudo dnf install epel-release -y
- Install Atop using the DNF package manager:
sudo dnf install atop -y
-
Verify the installation by checking the installed Atop version:
atop -V
- Update the package index using the following command:
sudo apt update
- Install Atop using the APT package manager:
sudo apt install atop -y
-
Verify the installation by checking the installed Atop version:
atop -V

Step 2: Monitor System Performance Using Atop
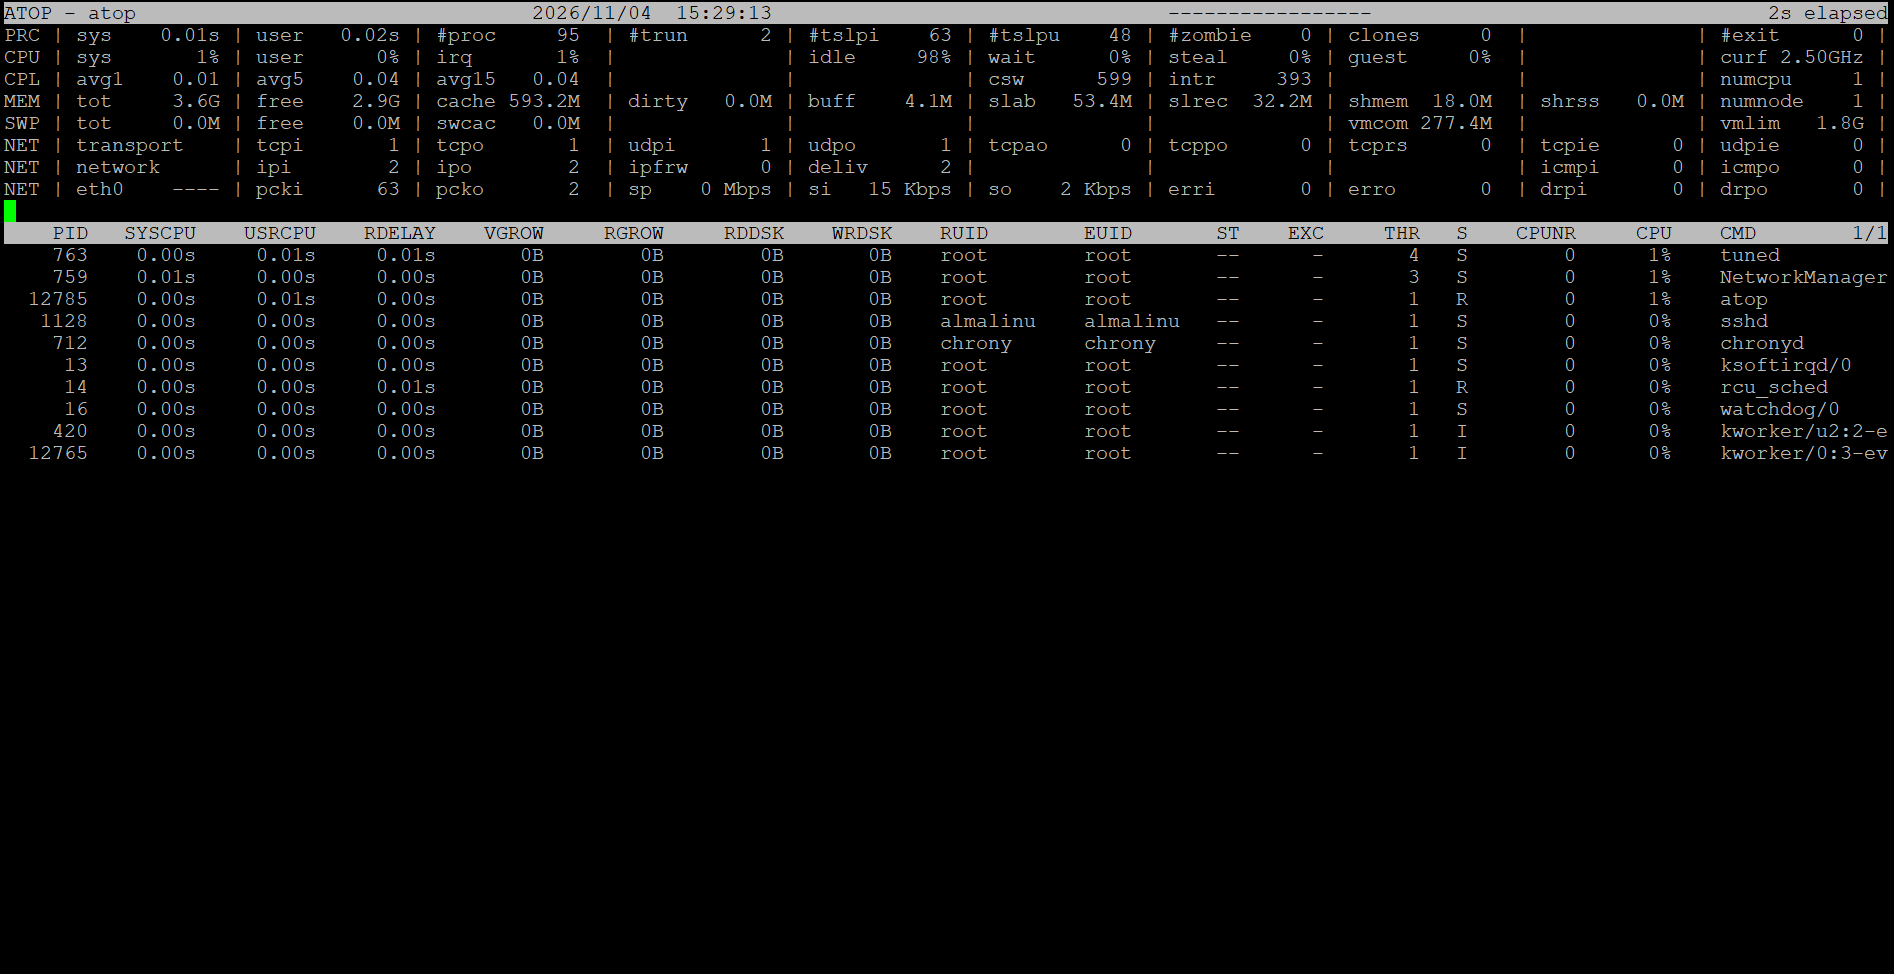
- Launch Atop to display system performance statistics in the terminal using the following command:
sudo atop 2
-
The Atop interface displays real-time system resource utilization, including CPU, memory, disk, network, and process activity.
-
Press q to exit the monitoring interface.
Step 3: Analyze System Resource Utilization
- In the Atop monitoring interface, review the system resource statistics displayed in the upper section.
- Identify the relevant indicators:
- CPU: Displays processor utilization and idle percentage. High CPU usage may indicate resource-intensive processes.
- MEM: Shows physical memory utilization, including free memory and cache usage.
- SWP: Displays swap memory utilization. High swap activity may indicate memory pressure.
- DSK: Shows disk read/write activity and utilization. Sustained high disk activity may indicate an I/O bottleneck
- NET: Displays network traffic and interface activity, helping identify unusual traffic patterns.
-
Observe Monitor these indicators across multiple samples to identify unusual resource utilization or potential performance bottlenecks.
Step 4: Identify Resource-Intensive Processes
- While Atop is running, use the following keyboard shortcuts to sort processes by resource utilization:
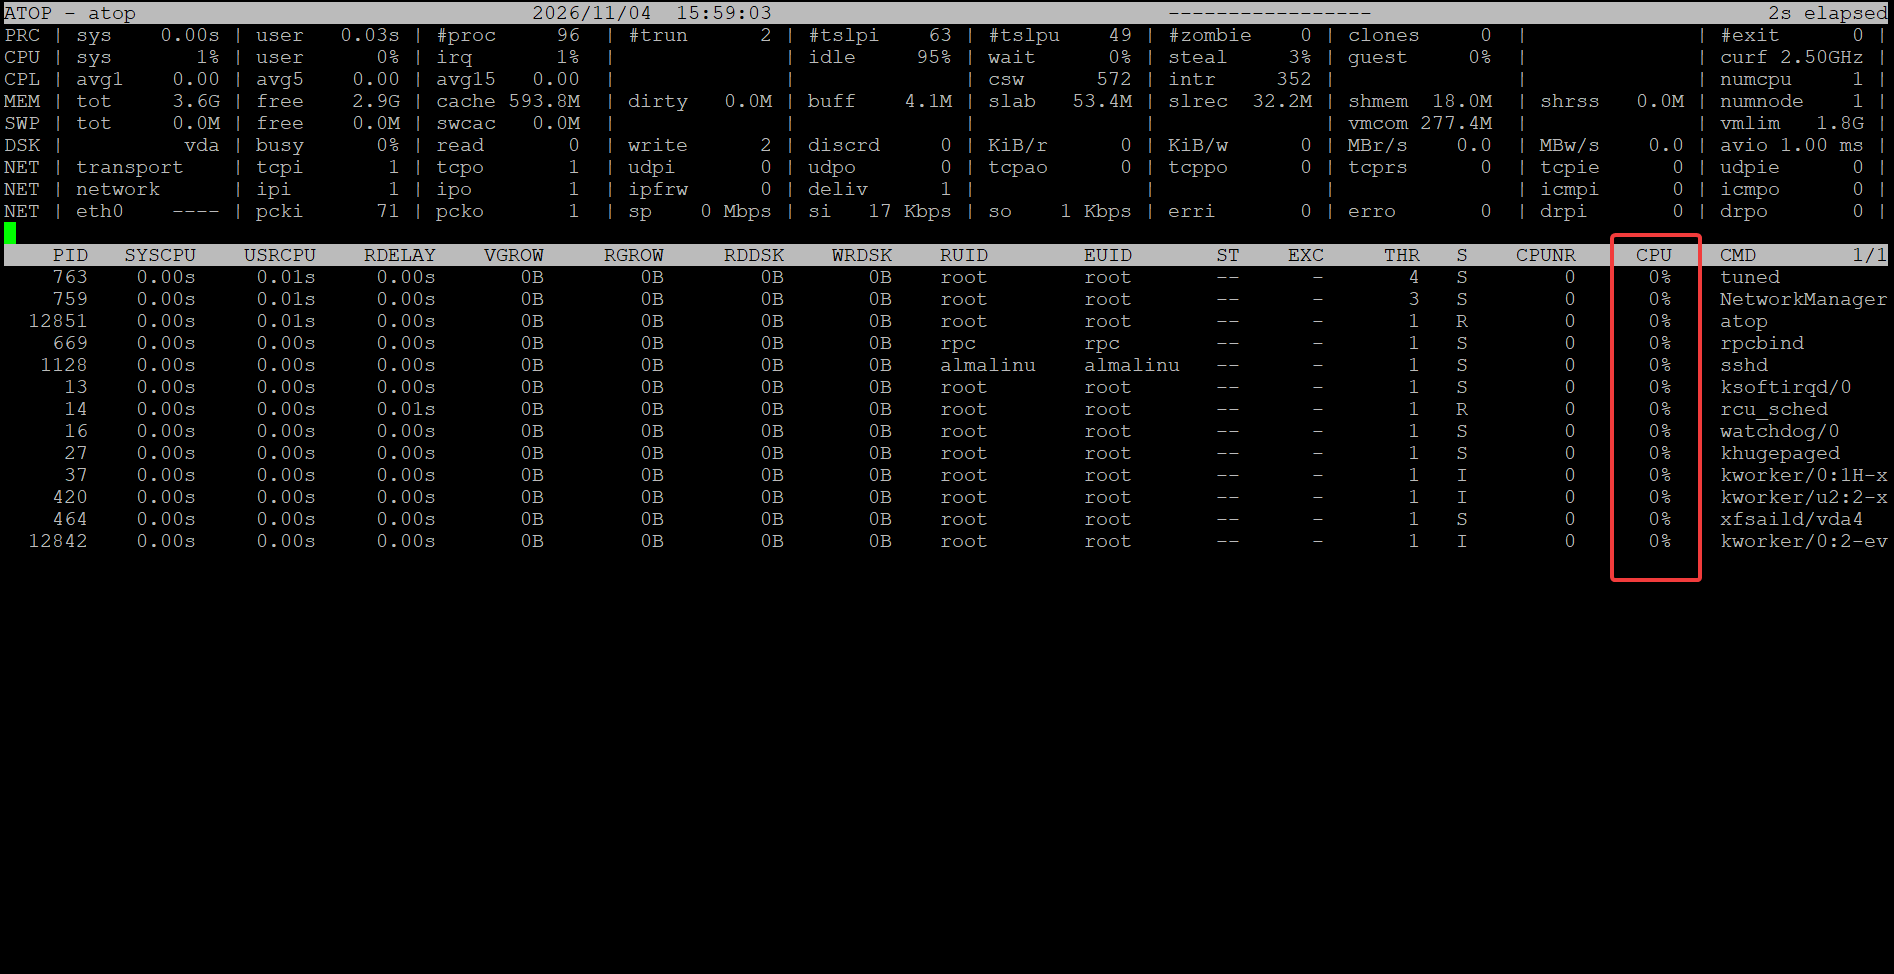
- Shift + C: Sort processes by CPU utilization.
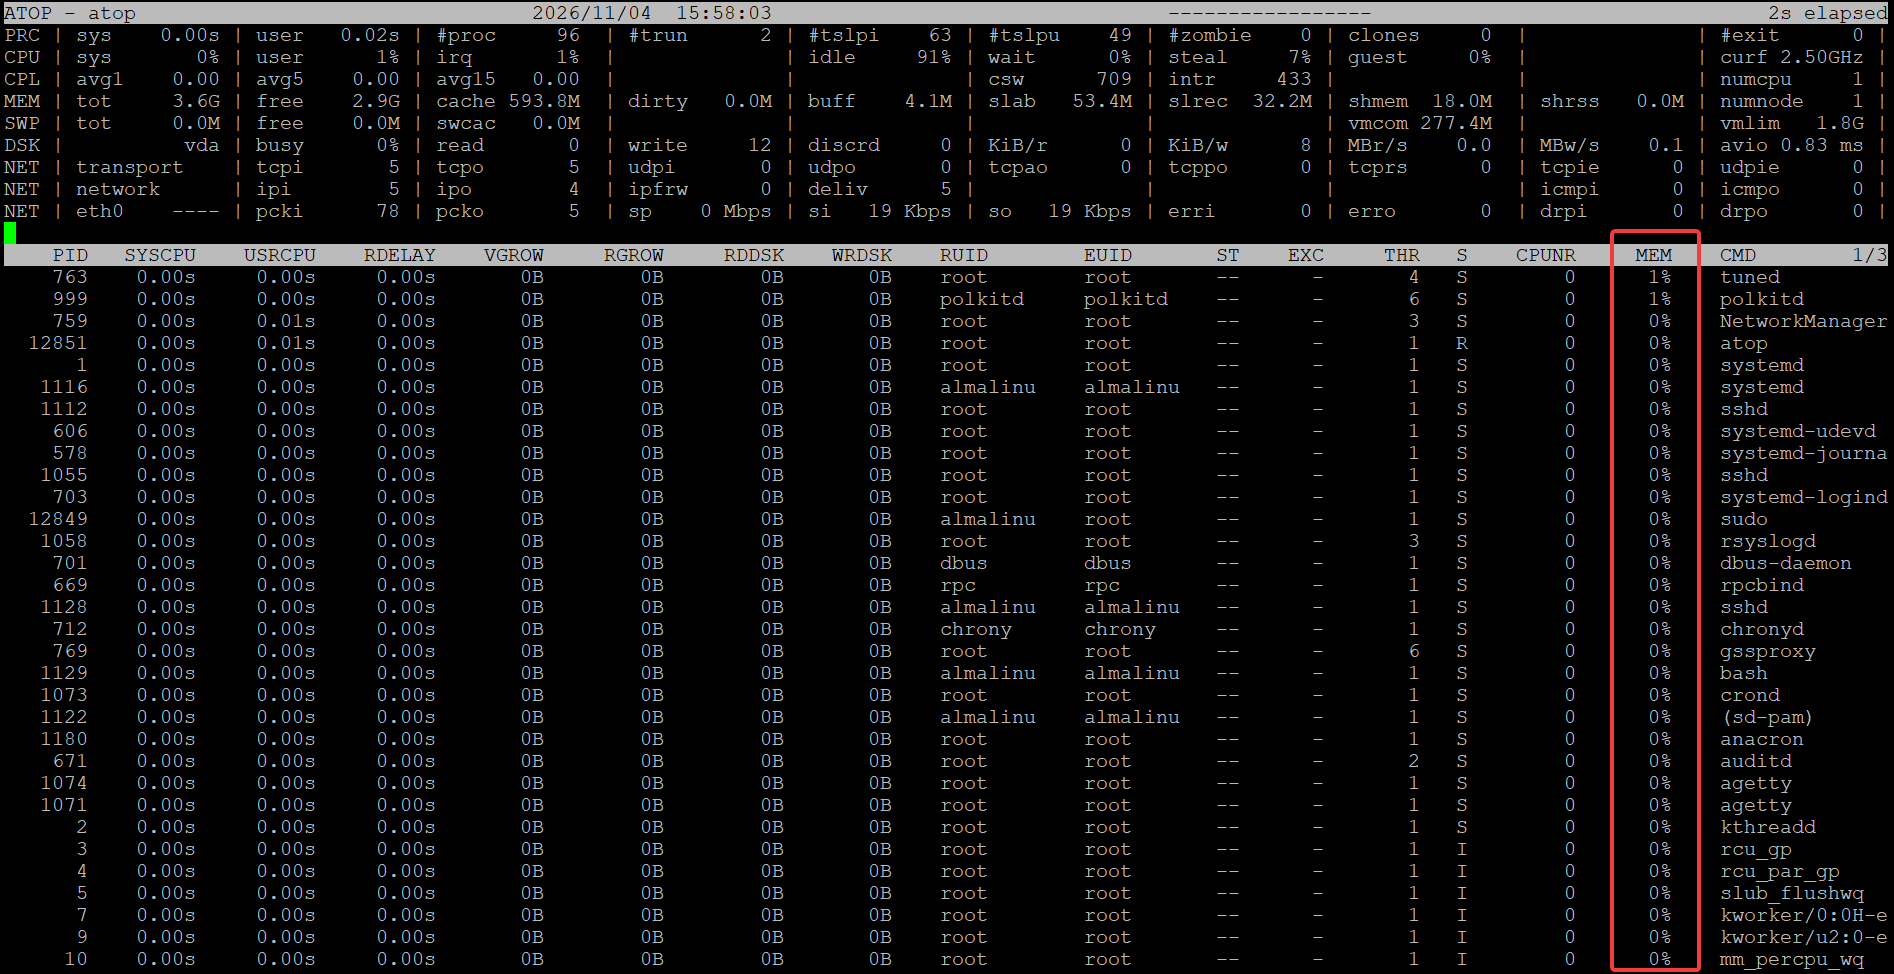
- Shift + M: Sort processes by memory utilization.
- Shift + D: Sort processes by disk activity.
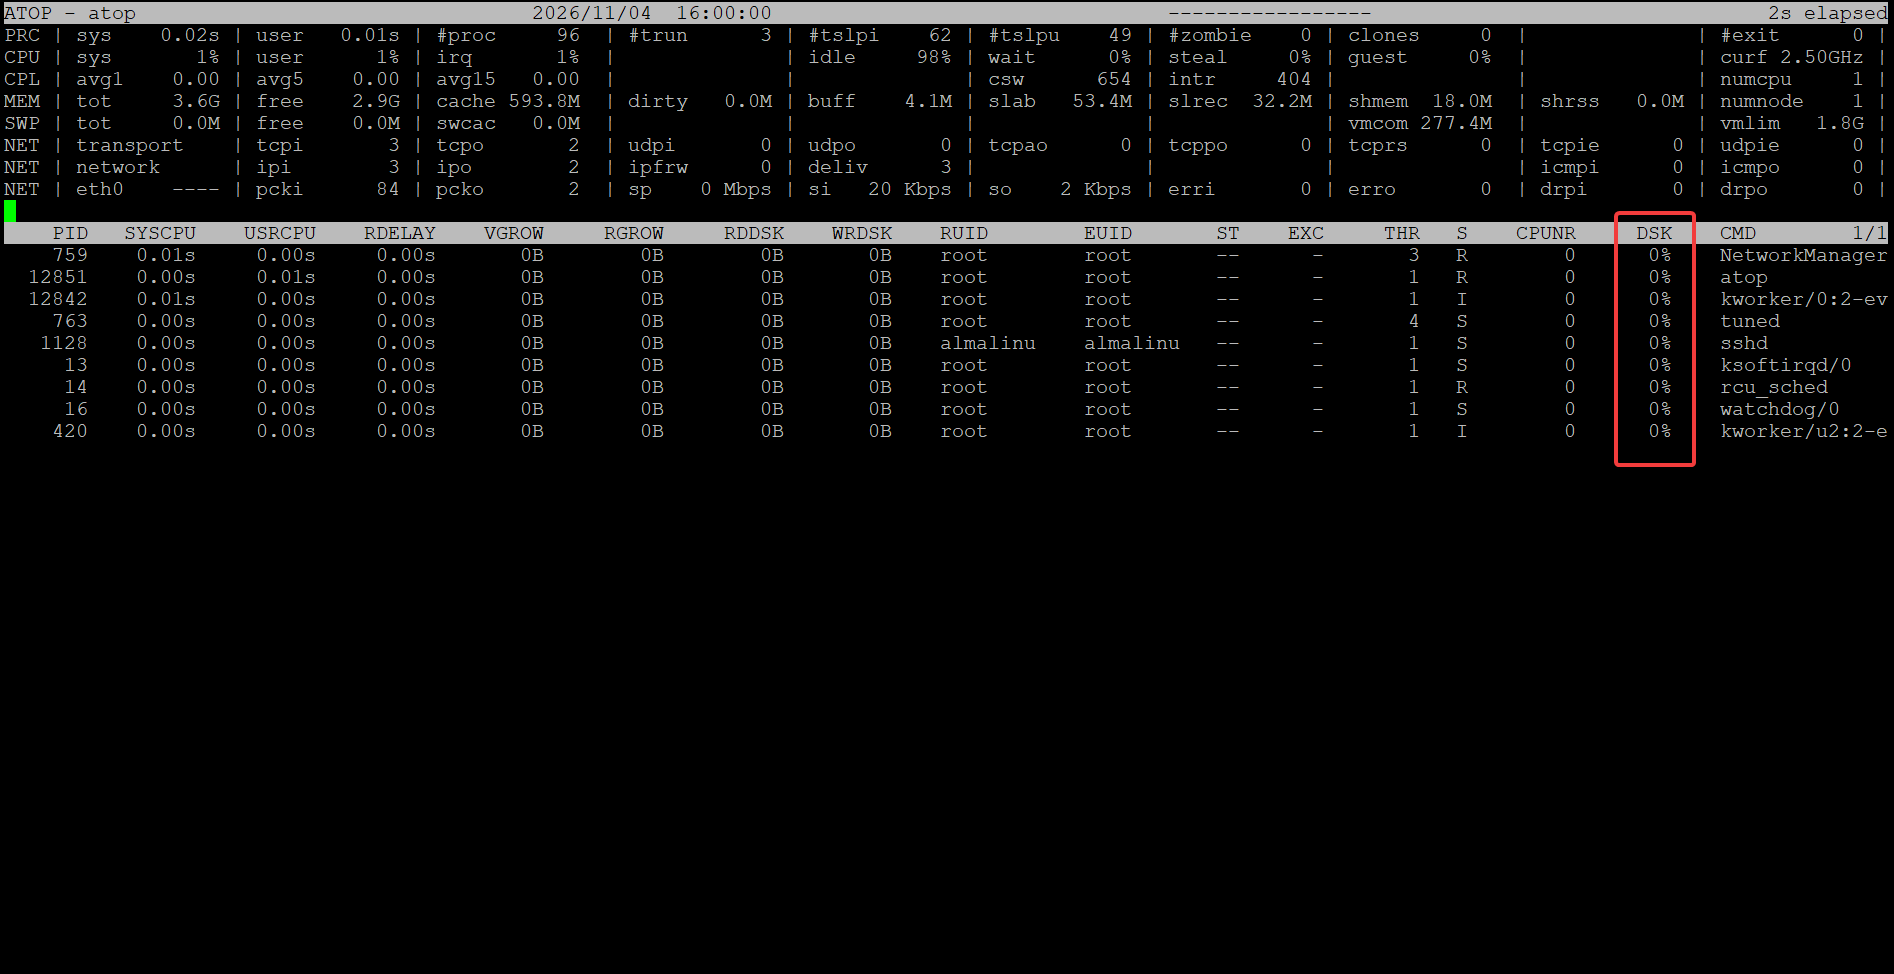
- Shift + C: Sort processes by CPU utilization.
-
Review the process list to identify processes consuming significant system resources.
-
Press g to return to the general process view.
- Launch Atop using the following command:
sudo atop 2
- Identify the Process ID (PID) of the process to monitor from the process list.
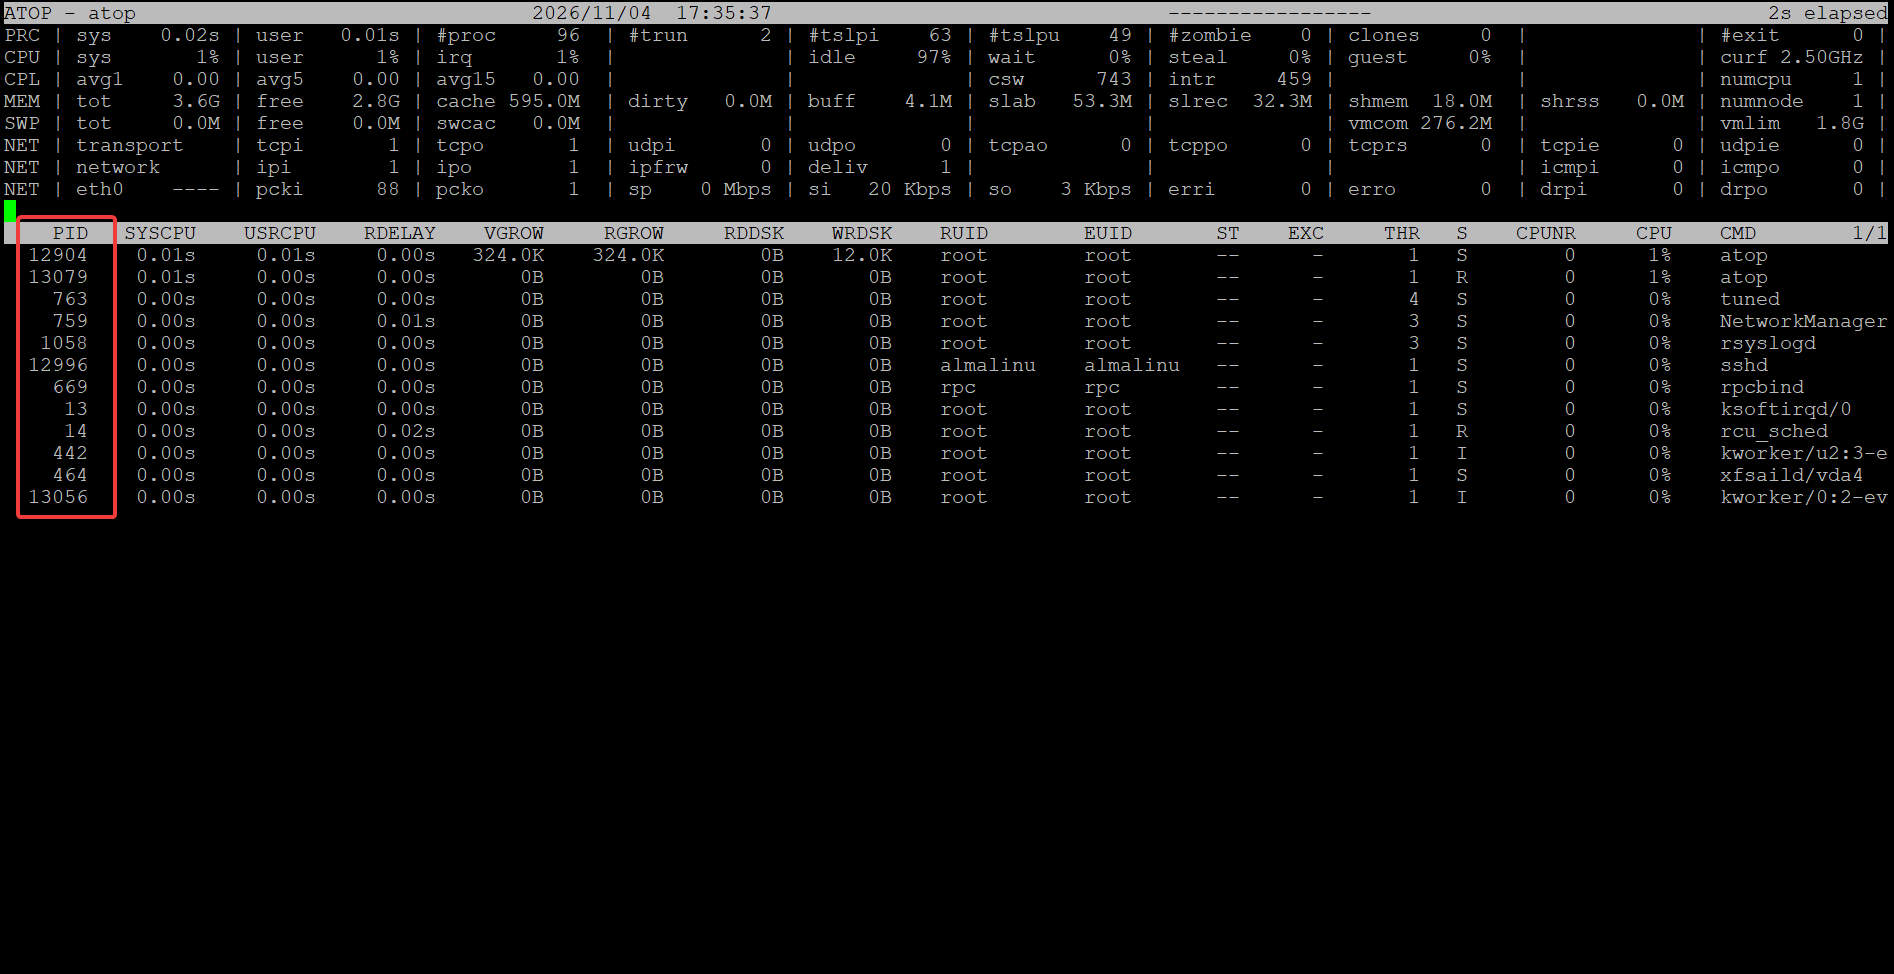
-
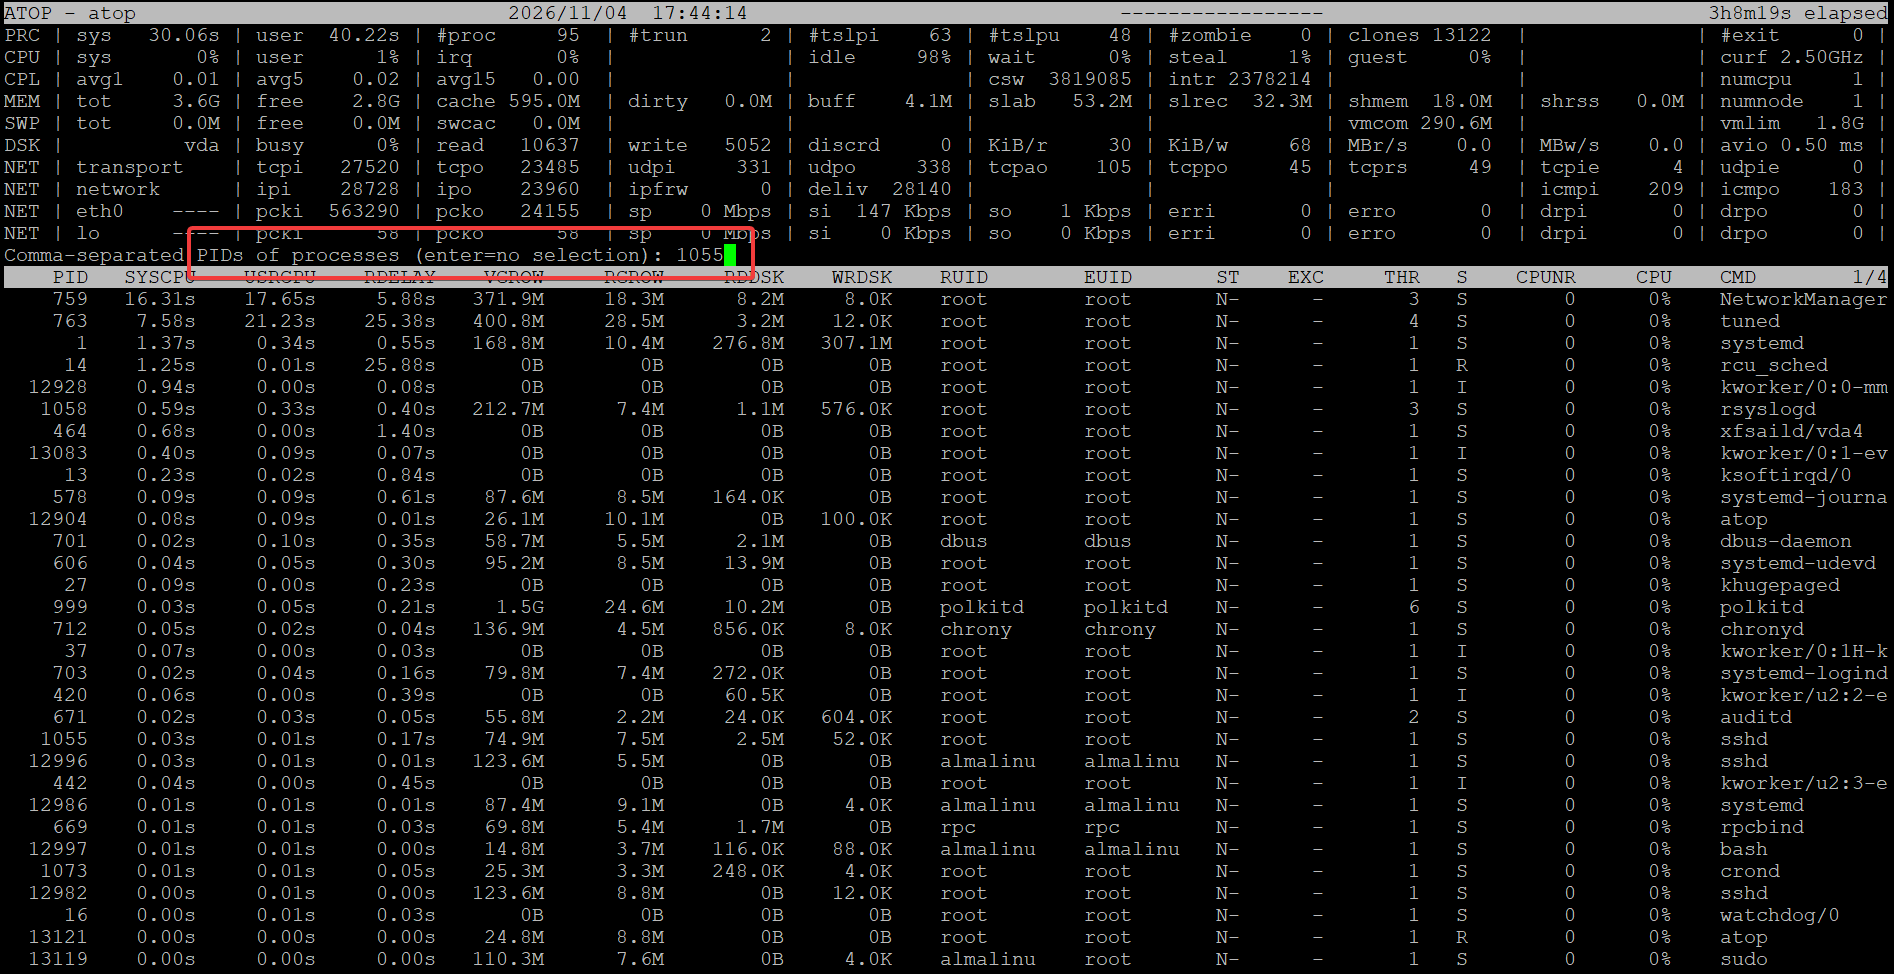
Press Shift + I, enter the selected PID, and press Enter to filter the process list.
- Review the selected process’s CPU, memory and disk activity using the available monitoring views.
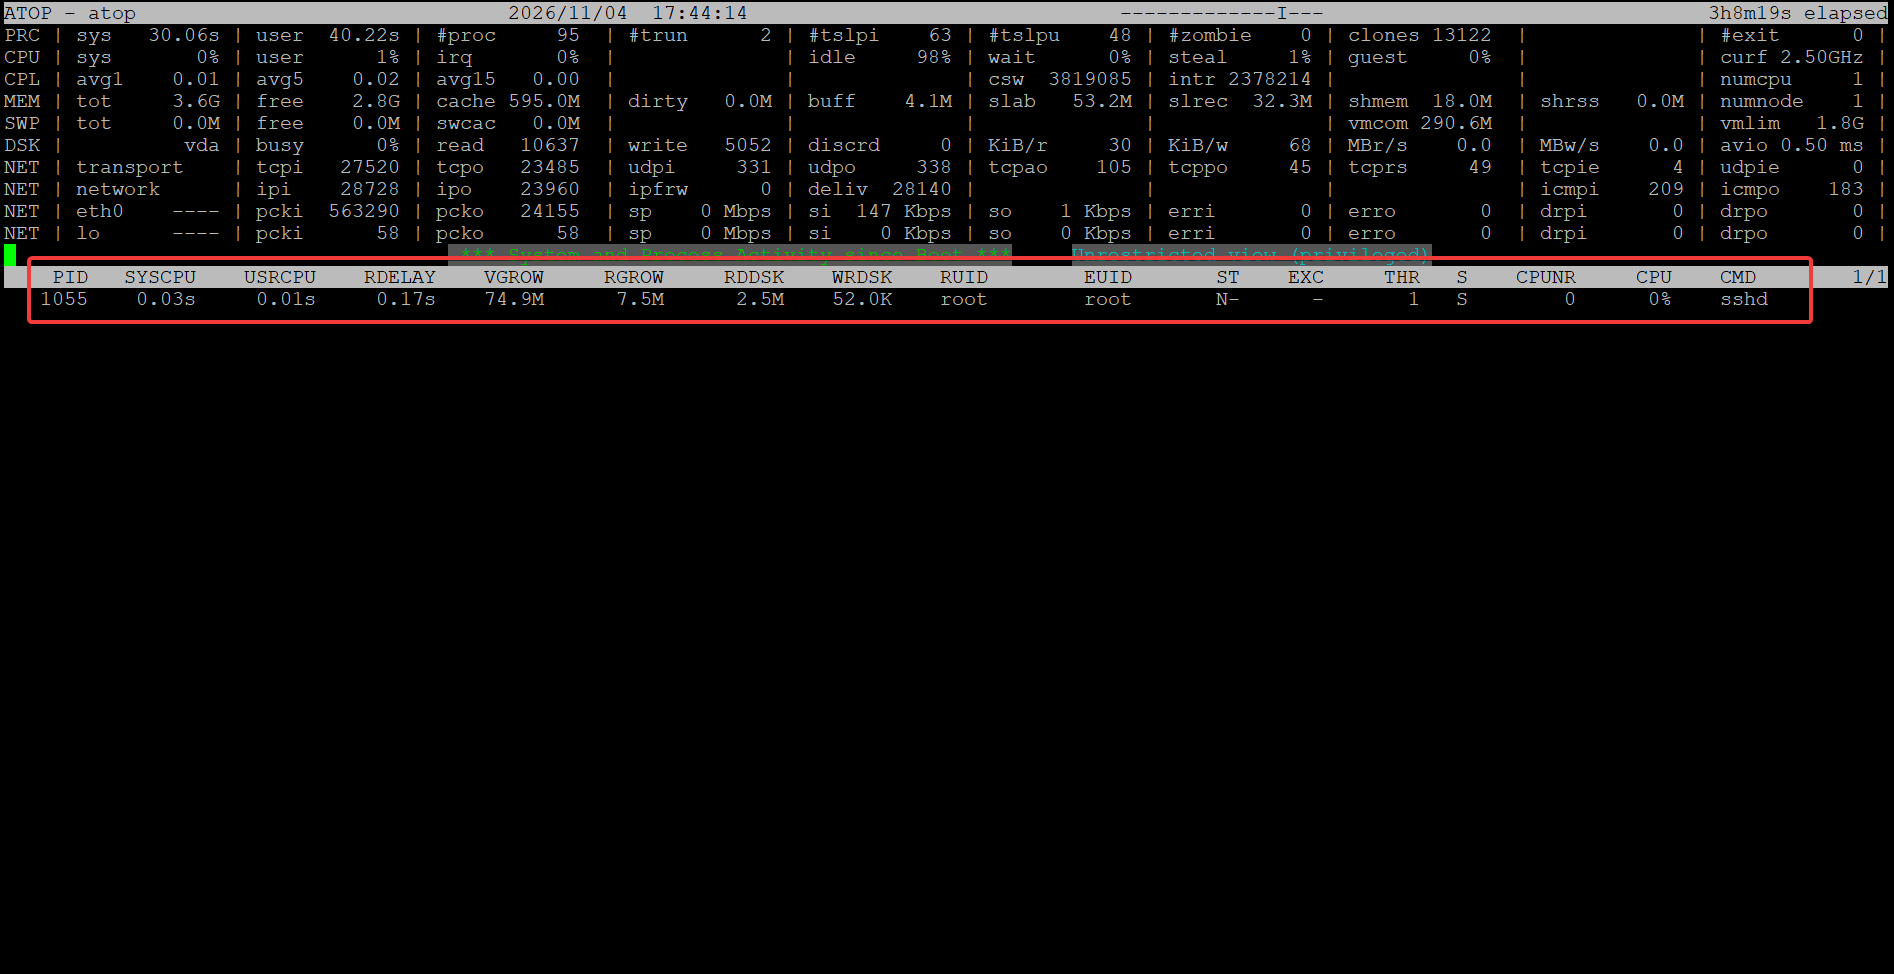
- To clear the filter, press Shift + I again and press Enter without entering a PID.
Step 5: Enable and Review Historical Performance Logs
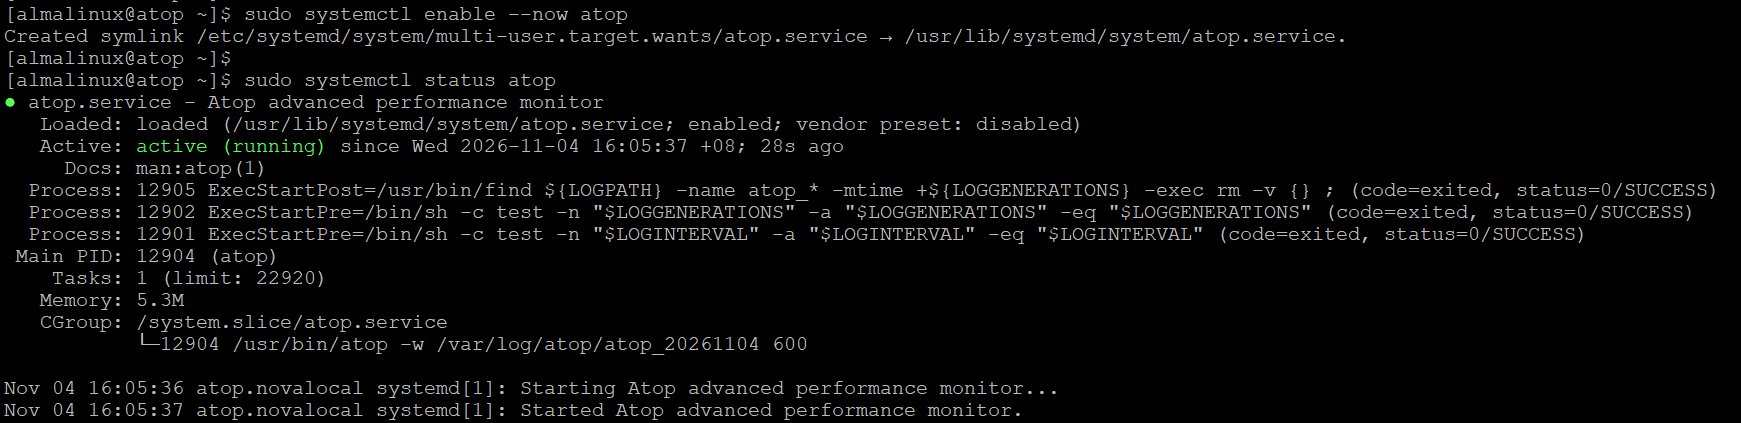
- Enable and start the Atop logging service:
sudo systemctl enable --now atop
-
Verify that the service is running:
sudo systemctl status atop
-
List the available historical log files:
sudo ls -lh /var/log/atop/

-
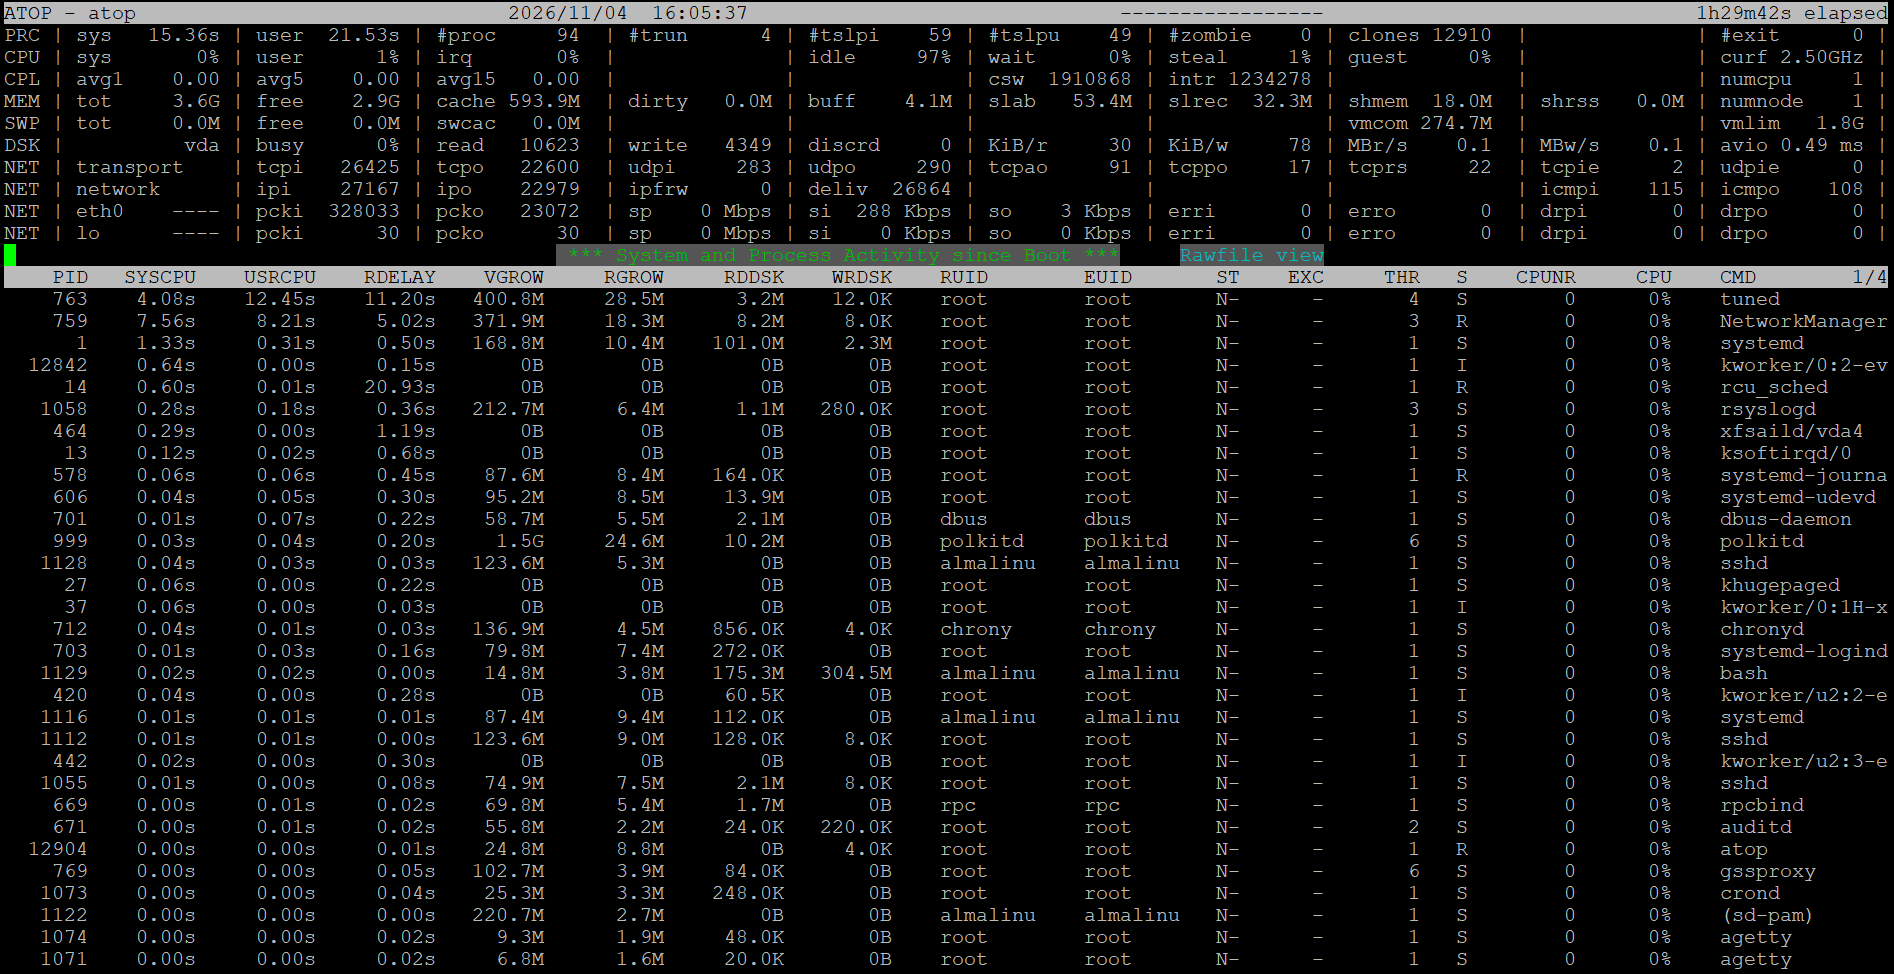
Open a recorded performance log using:
sudo atop -r /var/log/atop/atop_YYYYMMDD
Replace YYYYMMDD with the date of the log file.
-
Press t or T to navigate between recorded samples, and q to exit.
Conclusion
By following this guide, users can monitor Linux system performance using Atop, analyze CPU, memory, disk, and network utilization, identify resource-intensive processes, and review historical performance logs for troubleshooting and system optimization.
For additional assistance or if you encounter any issues, please contact our support team at support@ipserverone.com.